1. Problem Definition or Opportunity Statement:
To evaluate available tools for constructing a simple Bar Chart
The Project team lead for a scheduling team have asked the me to construct a Bar Chart to establish the overall tasks necessary to complete proposed scheduling job. The Bar Chart is to initially represent all activities required to complete the preparation of schedule for a project. The activity list is as shown in the table below.
Table 1 Activity List with relationships and duration

2. Development of Feasible Alternatives:
The alternatives that be developed for the construction of Bar Chart is to used available computer tools which includes;
(a.) Excel
(b) Microsoft Project
(c) Primevera P6 ( N/A)
3. Development of Outcome for Each Alternative:
The expect outcome for each alternative tool is to produce a Bar Chart that can provide additional information to the project team when used as a scheduling tool. The main feature to produce a Bar Chart that shows how activities are interrelated (logic) and possible show the shortest possible path(s) through that activities necessary for its completion.
4. Selection of Acceptable Criteria:
To accept a tool that meets the required objective for constructing Bar Chart, the tool selected will represent activities, their relationships and duration. These data are necessary to plan, monitor and control the scheduling task using Bar Chart.
5. Analysis and Comparison of Each Alternative:
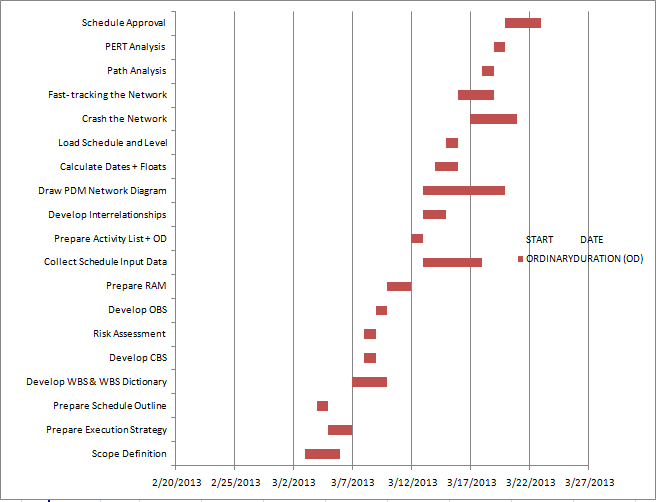
Using the activity list and duration table, Bar Charts for the proposed scheduling tasks were constructed using the Excel and Microsoft Project. The focus is to construct and "automated" Bar Chart that represents the schedule tasks and flexible to update and control. Figure 2 is the Bar Chart using Excel and have limited features apart from representing activities and on a time-phased scale. It does not depicts any feature or relationships between activities. Figure 3 represents Bar Chart constructed from Microsoft Project. It is a modified Bar Chart that shows activities, relationships and their durations.
Figure 2 Bar Chart constructed from Microsoft Excel 2007

Figure 3 Bar Chart constructed from Microsoft Project 2007
6. Selection of Preferred Alternative:
From the results of Bar Charts presented, Microsoft Project will be a better tool for scheduling Bar Chart for the schedule project and will provide more informations between activities and their relationships
7. Performance Monitoring and Evaluation of Results:
Performance of the Bar Chart will be evaluated and reported as it prove to be a valuable tool for the schedule team necessary to complete their tasks by observing and monitor activities represented on the Bar Chart.
References:
1. Humphreys G.C. (2002) Project Management Using Earned Value (2nd Edition) pp. 143 - 144 Orange CA Humphreys & Associates
2. Brassard, M. & Ritter D. (2010). Chapter 1 Gantt Chart (pp.9). The Memory Jogger 2 (2nd edition). USA:GOAL/QPC
3. Learning Services IT Guides : Gantt Chart in Microsoft Project 2010 Retrieved from:
AWESOME posting, Reginald!! Nice work......
ReplyDeleteMy only advice would be to look at some other alternatives.
Have you tried any of the open source software packages such as Open Workbench? http://open-workbench.en.softonic.com/
Another very good software package which has been around for a long time is is, IMPO, grossly under-rated is Microplanner.... http://www.microplanning.com.au/
Lastly, you should also consider any of the newer cloud based scheduling software packages? http://www.softwareadvice.com/construction/project-management-software-comparison/ or http://www.procore.com/
One other item- be sure to download the GAO's Exposure Draft to their Best Practices in Scheduling http://www.gao.gov/products/GAO-12-120G
Keep up the good work, Reginal..... I would like to see another blog posting but this time, try analyzing some of these other software packages as well?
BR,
Dr. PDG, Jakarta